Metrics Tools: Prometheus Operator
The Observability Stack uses Prometheus for storing local metrics data across both observee and observer clusters. It relies on the rancher-monitoring Helm Chart, which is derived from the kube-prometheus helm chart, for deployment.
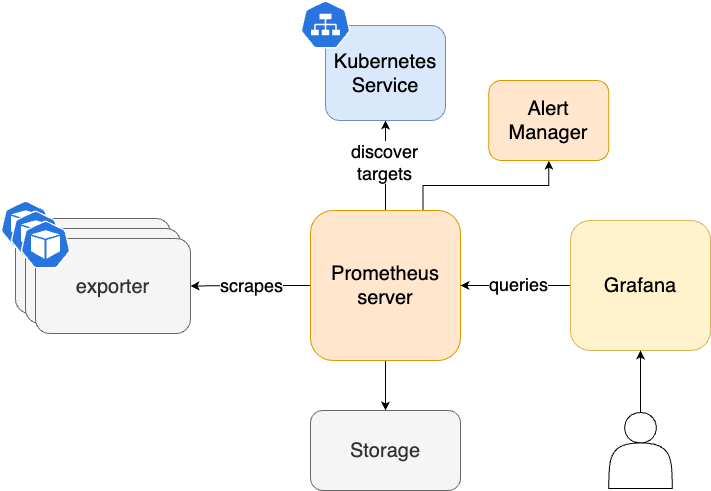
Architecture
Quickstart
In order to integrate Prometheus instances on observee clusters with the central Thanos setup on the observer cluster, the Helm chart must be configured with the prometheus.prometheusSpec.thanos configuration:
prometheus:
  prometheusSpec:
    thanos:
      image: quay.io/thanos/thanos:v0.34.0
      objectStorageConfig:
        key: thanos.yaml
        name: thanos-objectstorage
This configuration requires the thanos-objectstorage S3 connection details, structured as follows:
type: S3
config:
  bucket: <thanos-object-storage-bucket-name>
  endpoint: <s3-endpoint>
  region: <region>
  aws_sdk_auth: false
  access_key: <access_key>
  insecure: false
  signature_version2: false  # Equivalent to v4auth: true
  secret_key: <secret_key>
  bucket_lookup_type: path  # Equivalent to pathstyle: true
To create this secret via kubectl, use the following command, ensuring your YAML manifest is saved to a file (e.g., thanos-s3-creds.yaml):
kubectl create secret generic thanos-objectstorage --from-file=thanos-s3-creds.yaml
For Rancher Cluster Manager deployments, two additional parameters needs to be set in the values.yaml in order to integrate Rancher Cluster Management UI with the integrated monitoring (for more information, you can check this Github issue).
global:
  cattle:
    clusterId: global.fleet.clusterLabels.management.cattle.io/cluster-name
    clusterName: global.fleet.clusterLabels.management.cattle.io/cluster-display-name
An example values.yaml is provided within the repository.
Advanced Configuration
Special Configuration for Envoy Sidecar Approach
When utilizing Envoy Sidecar for Thanos to enable connectivity between Prometheus and Thanos instances across observer and observee clusters, it may be necessary to make the sidecar component accessible through an ingress object. This requires specific annotations to support the backend-protocol: "GRPC".
apiVersion: networking.k8s.io/v1
kind: Ingress
metadata:
  name: observability-thanos-gateway
  annotations:
    nginx.ingress.kubernetes.io/backend-protocol: "GRPC"
    nginx.ingress.kubernetes.io/force-ssl-redirect: "true"
    nginx.ingress.kubernetes.io/grpc-backend: "true"
    nginx.ingress.kubernetes.io/protocol: "h2c"
    nginx.ingress.kubernetes.io/proxy-read-timeout: "160"
spec:
  ingressClassName: nginx
  rules:
    - host: [clusterName].observability.[yourdomain].com
      http:
        paths:
          - backend:
              service:
                name: prometheus-operated
                port:
                  number: 10901
            path: /
            pathType: Prefix
  tls:
    - hosts:
        - [clusterName].observability.[yourdomain].com
      secretName: thanos-gateway-tls
To automate deployment across both observer and observee clusters, the Observability Stack leverages overlays and targetCustomizations in Fleet. Example configurations for deploying in observer and observee clusters are located within overlays/observee-cluster01 and overlays/observer-cluster directories, respectively. If cert-manager is set up in your cluster, it's possible to automate the generation of SSL certificates for ingress objects. Additionally, external-dns can be utilized alongside to dynamically generate DNS records.
Thanos Sidecar Monitor
In order to enable the Thanos sidecar metrics gathering, a ServiceMonitor object needs to be created as a seperate object. An example configuration is under the base directory and can be used directly.
apiVersion: monitoring.coreos.com/v1
kind: ServiceMonitor
metadata:
  name: rancher-monitoring-thanos-sidecar
  labels:
    app: rancher-monitoring-prometheus
spec:
  namespaceSelector:
    matchNames:
      - cattle-monitoring-system
  selector:
    matchLabels:
      app: rancher-monitoring-thanos-discovery
      release: rancher-monitoring
  endpoints:
    - port: http
      path: /metrics
External Secrets
For an automated setup, the S3 connection secret thanos-s3-creds.yaml should be integrated into the base directory alongside the Prometheus components. A corresponding kustomization.yaml file ensures the automatic creation of the secret. This setup supports both regular Kubernetes secrets (without encryption) and more secure approaches like integrating with HashiCorp Vault, utilizing the external-secrets-operator to import the secret as an ExternalSecret object.